
Accolent ERP uses an embedded third-party Business Intelligence and Reporting solution to deliver reports across the system. Accolent ERP is delivered with multiple standard reports. Accolent ERP forms are special-purpose reports. All reports and forms may be viewed and edited directly from a web browser using HTML5 technology. This in-browser editing allows users to modify existing reports, create new reports and customize forms, as needed.
Creating New Reports
- Accolent ERP forms and reports are delivered by Stimulsoft, a third-party reporting solution, which allows all forms and reports to be customized using the in-browser report designer and editor.
- The report designer is fairly intuitive and there are several how-to videos that can be viewed on the Stimulsoft YouTube Channel.
- Using the report designer, users can modify existing forms and reports or create new reports.
- All the data for reports are delivered through SQL Views.
- Use of these pre-made SQL Views means that end-users do not have to query the SQL database, understand the database schema or have to worry about table joins or u nions.
- Each SQL View has all the fields available to reports in that functional area.
- All report views are labeled as ADSv{FunctionalArea}_Master, in this case the FunctionalArea is CommissionsReport.
- There is an Accolent ERP wiki for each report view, detailing the fields available in that report view.
- Our professional services team is available to: (1) do the modifications for you if you wish, (2) help you complete modifications you started, (3) troubleshoot/fix some changes you attempted that failed, or (4) add a field that is not already available in the View, if it is appropriate to that functional area.
- We will charge you at our standard rates for the time our professional services team spends on your reports requests.
Types of changes
- Some types of reports changes can be done easily, and others are more complicated.
- Modifying existing reports to change the format or labels is very straightforward.
- Adding fields that are already in the SQL View to an existing report is straightforward and should be within the capabilities of most users.
- Changing sorts, groupings and sub-totals on existing reports is a little involved but may be possible for some users; however, there is some possibility that you will break the report and need our assistance.
- Creating new reports from scratch using an existing SQL View is quite challenging, but may be possible for technically proficient users; we will probably need to help you troubleshoot/fix problems.
- Adding fields to an SQL View should not be attempted as you will need to understand how to write SQL queries and will need to understand the database schema; also writing incorrect SQL queries can hang your whole system.
Reports Templates
- Every report has to have a configured database connection, a data source and a set of defined parameters, in addition to the report data.
- To create a new report, go to Reports > Create New Report.
- This will bring up the screen showing pre-made report templates.
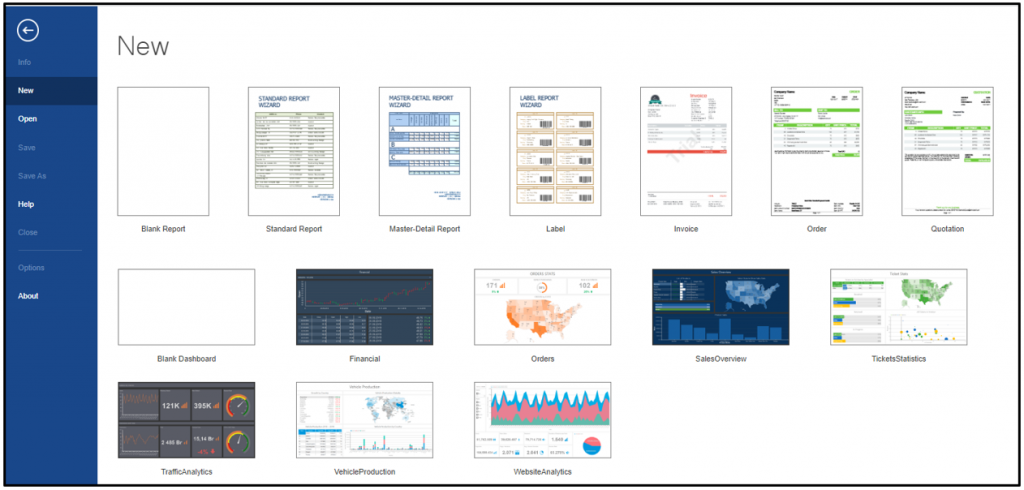
- Select an existing template and modify this to create the report, or select blank report.
- The AccolentDBConnection will already be created.
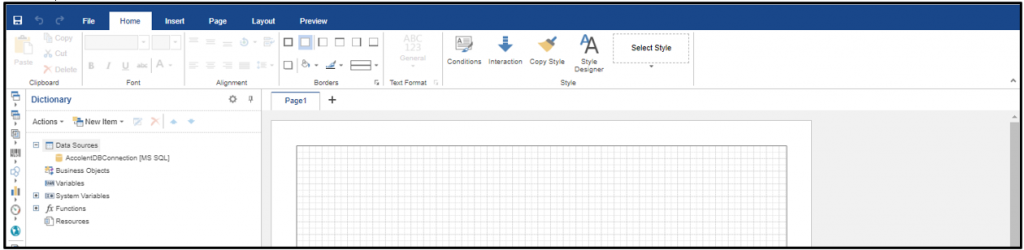
Select Data Source from Reports Views
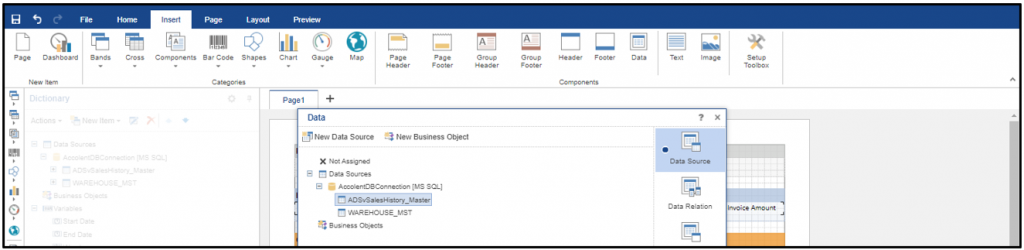
- Click on New Item, select New Data Source and select AccolentDBConnection.
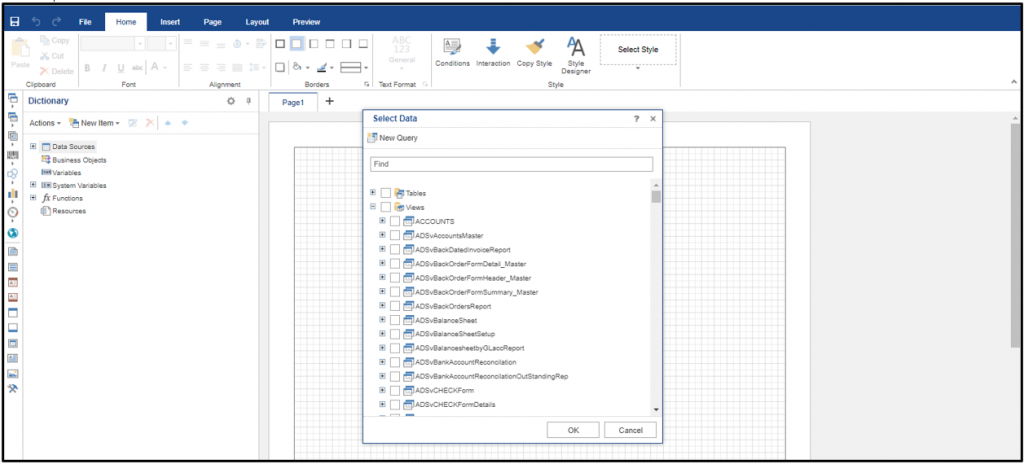
- The system will load all the available Tables, Stored Procedures and Views in the database.
- Collapse the Tables and Stored Procedures and select from the Report Views which will all follow the naming convention: ADSvFunctionalArea (e.g., ADSvSalesHistory).
- There are wikis that detail the fields available for each Report View.
- Select the Report View desired and click OK.
Define Variables for Parameters
Start Date
- All reports must have parameters; in this case say a Start Date and an End Date and a Warehouse.
- Before these can be added as parameters to the report they first need to be set up as variables.
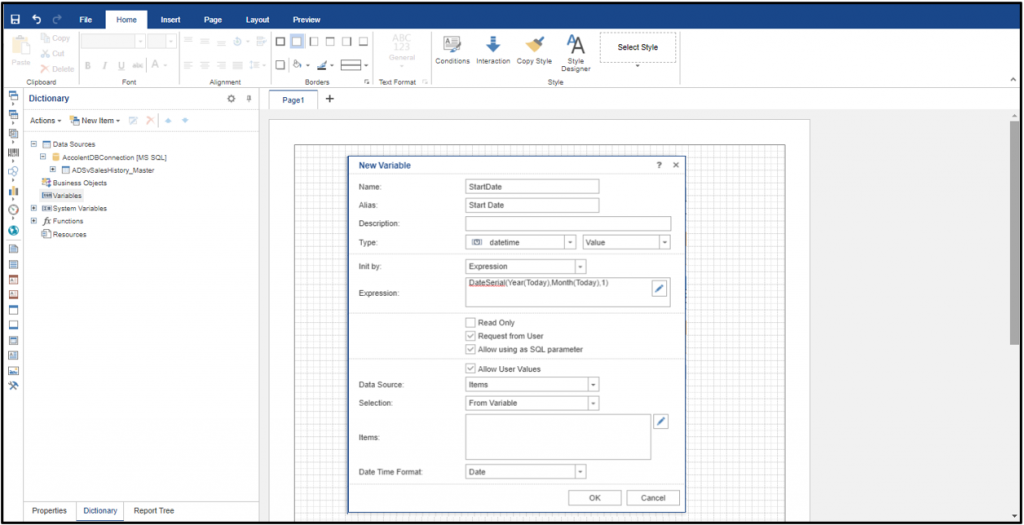
- To set up the variables, click on Variables in the left-hand pane then New Item and select New Variable.
- Enter Name as StartDate – (NOTE: there cannot be any blank spaces in the Name entry), select Type as datetime.
- Init by provides the default value, use this Expression that returns the 1st of the current month: “DateSerial(Year(Today),Month(Today),1)”.
- Then select Request from User and Allow using as SQL Parameter, since the user will enter the start date.
- Go down to the Date Time Format field and select Date.
- Then click OK to complete this variable.
End Date
- Repeat to create the EndDate variable, but in this case, the default value of today’s date can be generated by the Expression “Today”.
Warehouse
- To create the Warehouse variable we first need to create a new data source to get the Warehouses set up in the system.
- Click New Item and select New Data Source; as before click on the AccolentDBConnection but this time, use the Table: WAREHOUSE_MST.
- Once the Data Source is defined, click Variables > New Item > New Variable as before.
- In this case, Type is string, List (this allows selection of multiple warehouses), uncheck Allow User Values, Data Source will be Data Columns, Keys will be the warehouse_id and Values will be the ware_name.
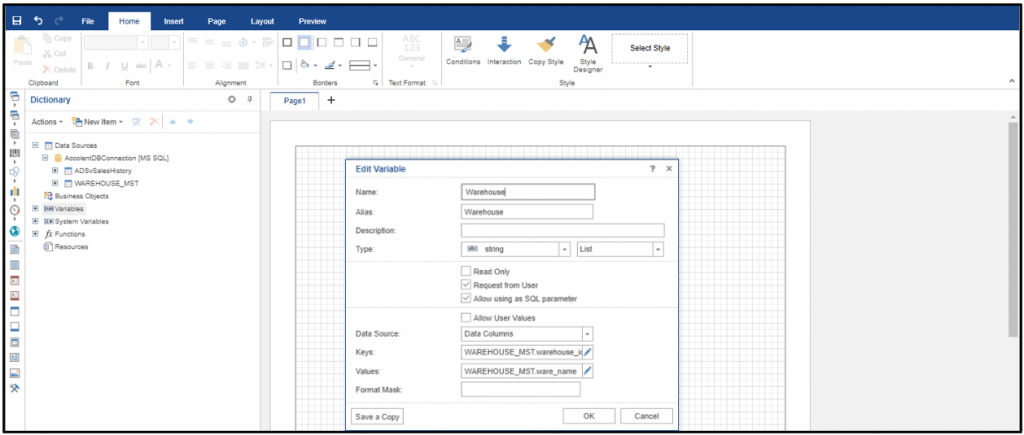
- Then click OK to complete the variable.
- All report parameters are now created as variables.
Add Report Parameters to View
- The report parameters now have to be added to the View ADSvSalesHistory_Master; to do this select the View then click on Edit Data Source.
- The first thing that has to be done is add the Start Date and End Date as a where clause to the SQL Query; the syntax is “where [Order Date] between @Startdate and @Enddate”.
- The [Order Date] field must be selected from the View ADSvSalesHistory_Master.
- Scroll down to and click on Parameters, then click on the New Parameter button.
Start Date
- Enter Name @Startdate, Expression StartDate and Type Date.
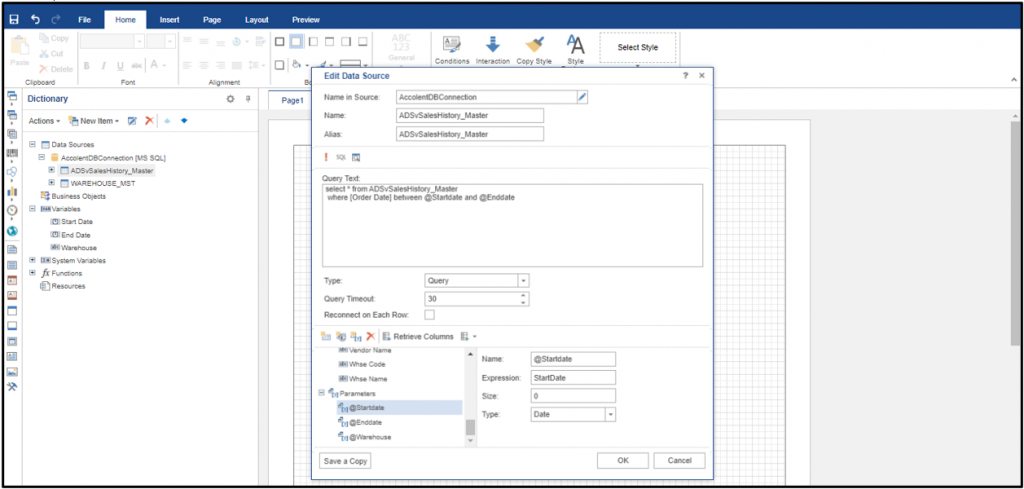
- Then click OK.
End Date
- Click on the icon to add another parameter for EndDate.
- Repeat the steps for Start Date for the End Date.
Warehouse
- If the Warehouse variable had been set up for a single Warehouse, then we would need to pass the Warehouse Code as a parameter.
- However, since this is a multiselect no parameter is needed for Warehouse; instead, the View will get all the data for all Warehouses.
- We will use the Data Filters to filter by Warehouse Code.
Test the Parameters
- Once the parameters are set up, click on the red exclamation mark icon towards the top of the screen to test the query.
- If set up correctly you will get this result.
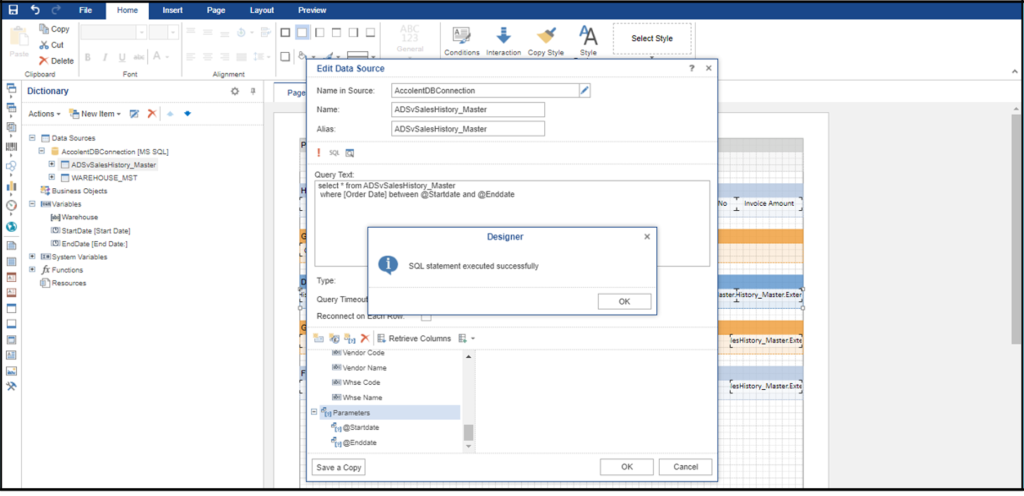
- Then click OK.
Create the Report
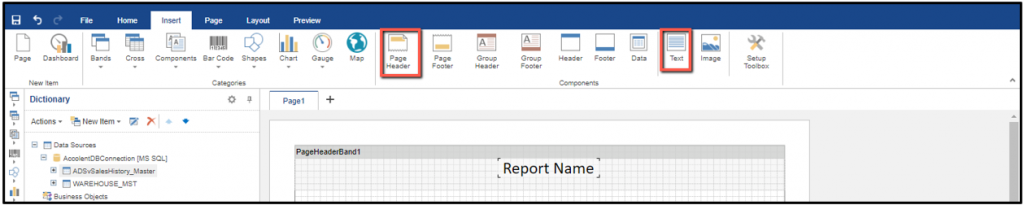
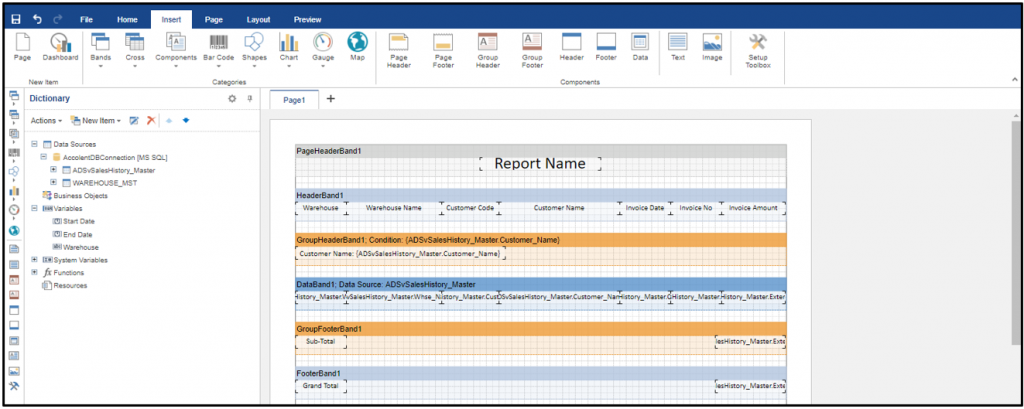
- The report needs the following bands to be set up: a Page Header, a Header, a Group Header, then a Data band, then a closing Group Footer and a closing Page Footer.
- To create a band, double click on the icon at the top of the screen then click on the page template where you want to create the band.
Page Header
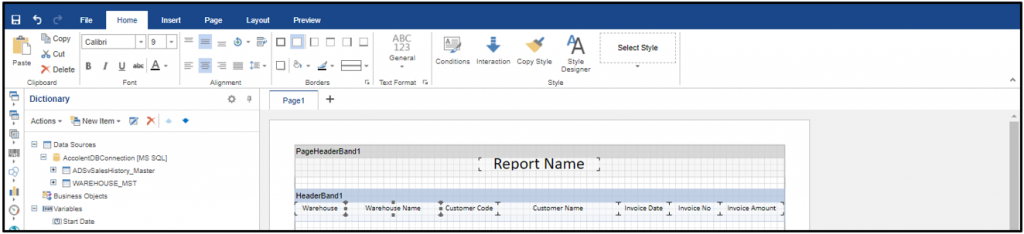
- Add PageHeaderBand1, then add a text box to it to provide the report name.
- Drag the Text box to position and size it, then use the format options on the Home tab to configure the appearance.
Header
- Add a Header band.
- In the header band, you will specify all the columns you want to appear in the grid and provide Text boxes with the grid titles.
- Once you set up one text box, you can use the Copy/Paste functionality to copy across and then edit the labels.
Group Header
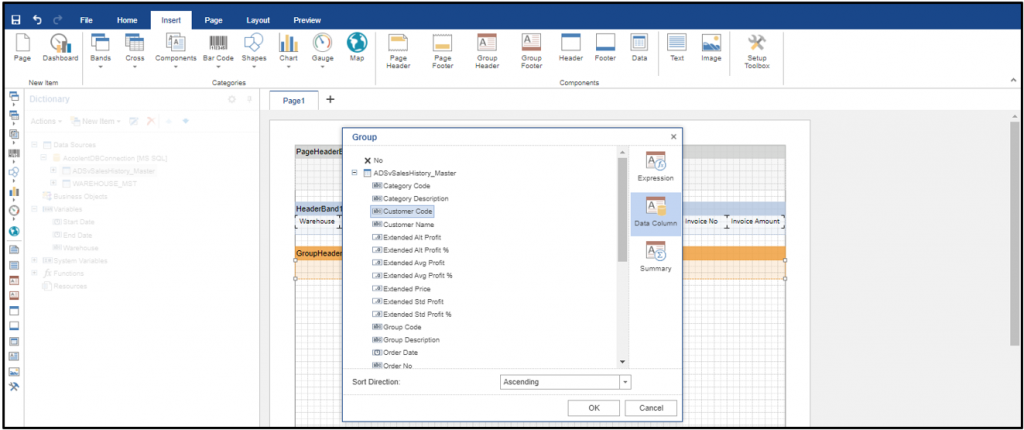
- Add a Group Header.
- This will let you specify how to group and sub-total the data in the grid.
- You can also specify multiple groupings to be applied in sequence.
- To specify which Data Column you wish to group by, double click in the Group Header Band and select the field.
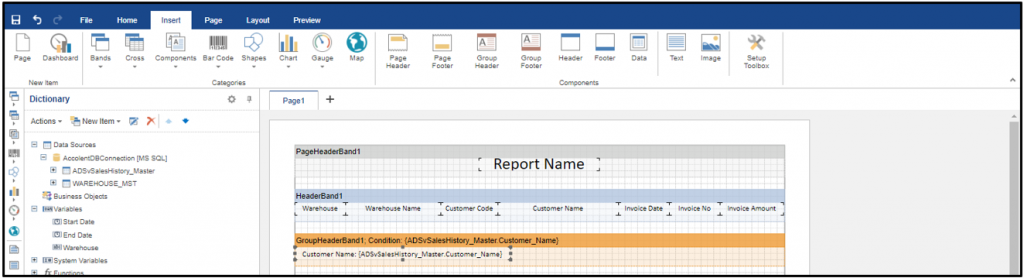
- Now add a text box to provide the label for the grouping; first, select Data Column and select the variable from the View.
- You will see in the Text box: {ADSvSalesHistory_Master.Customer_Name} – the curly parentheses denote that this is a variable.
- Click on HTML to edit the Text box to add the label “Customer Name:” in front of the curly parentheses.
Data Band
- Add a Data band and assign the values from the View.
- Now in the Data band create the same text boxes that correspond to the text boxes set up in the Header band.
- Once you create a text box, double click on it and select the Data Column from the View that will populate that text box.
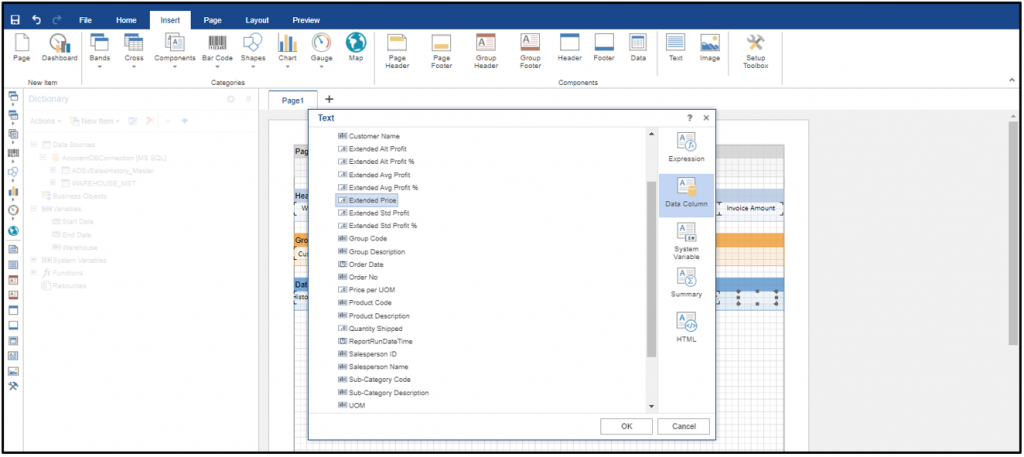
- When complete the Data Band will look like this:
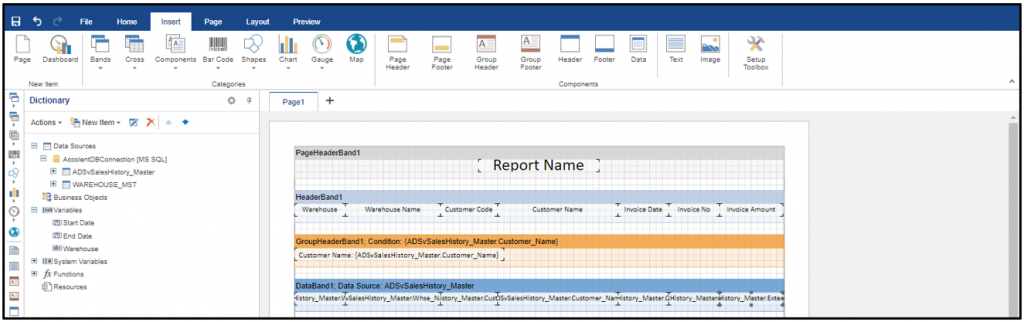
Group Footer
- Add a Group Footer which will specify how the data gets sub-totaled.
- Add text boxes for the label “Sub-Total” and for the value that will be sub-totaled; in this case, we are sub-totaling only the invoice total column.
- To create the sub-total first select the Data Column from the View then enter an expression that creates the sub-total.
- Selecting the View field will yield this {ADSvSalesHistory_Master.Extended_Price}, this has to be edited inside the curly parentheses as {Sum(ADSvSalesHistory_Master.Extended_Price)} to create the sub-total.

Footer Band
- Then add a Footer band and sub-total again to create the grand total.
- This follows the same steps as the group-by sub-total.
- As with Excel, the sub-total and the grand total of the sub-totals follow the same syntax.
- The system automatically recognizes that the Footer band grand total should not include all of the group band sub-totals.
Filters and Sorts in the Data Band
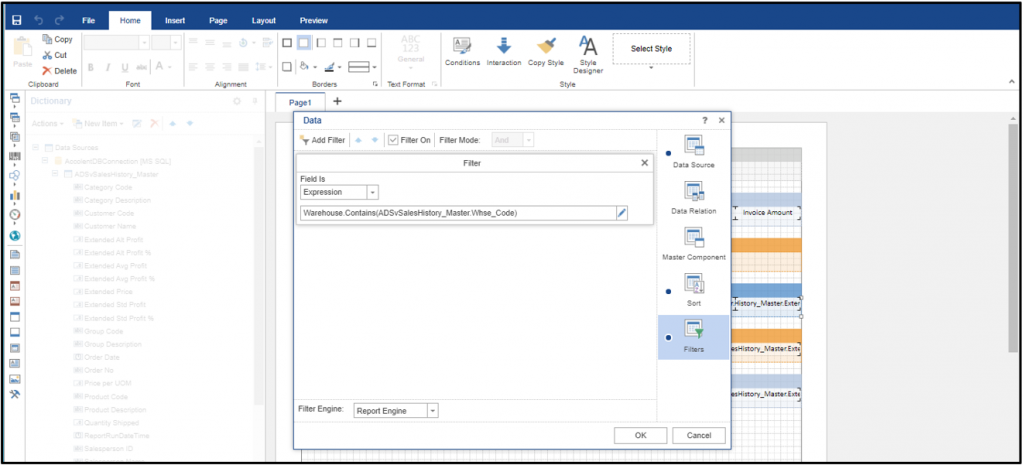
- Double click on the Data Band row to open the Data screen.
- Use the Filters to set up the filters by Warehouse.
- Since this is a multiselect, for Field Is use Expression rather than Value.
- To filter on Warehouse enter “Warehouse.Contains()”, position cursor inside brackets () and select Data Source: ADSvSalesHistory_Master and Field: Whse_Code.
- The Sort can be used to control how the data is displayed within the Grouping selected.
- In this case select Whse_Code to Sort by in Ascending order.
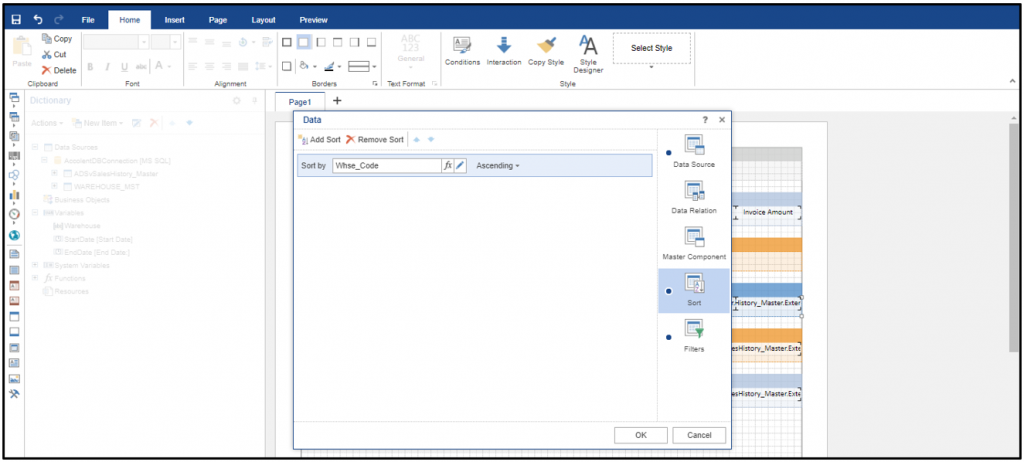
- Then click OK to complete the report.
Preview Report
- To preview the report, select preview and enter the parameters then submit.
- The report can then be properly formatted to fix labels, fix alignments, line up columns, provide row fill colors and grid lines, etc.
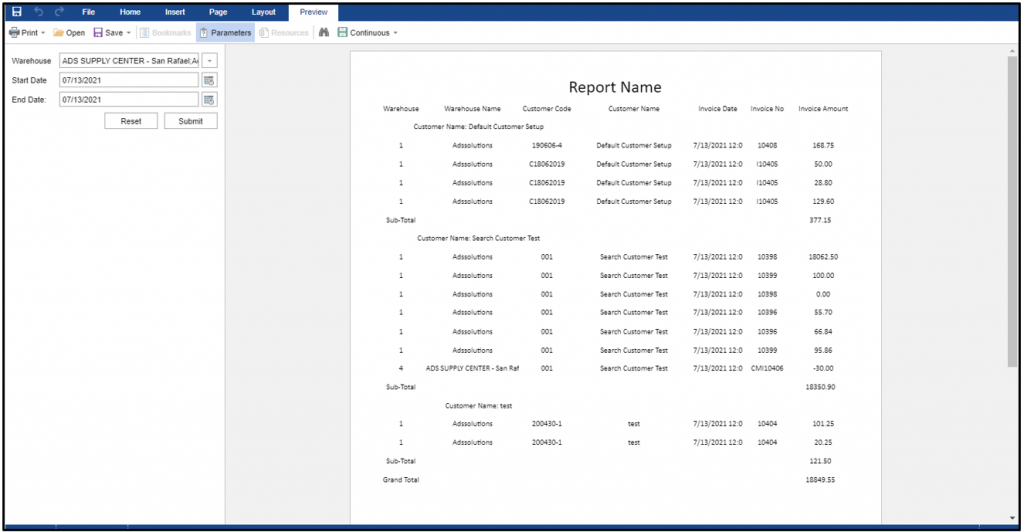
- When done click Save.
- The new report will be saved in Report Center under the group Custom Reports as NewReport.mrt with Report No 11168.

- If the report is renamed, you will have to log out and then log in again to access the renamed report.