
Accolent ERP reports are run from Reports Center and are delivered in a variety of formats. All reports may be printed on standard 8.5“ x 11” paper or exported in a variety of formats, including Excel to facilitate analysis. There are a number of settings that control how an export to Excel is delivered depending on whether the download is to be formatted or not formatted. For data analysis using Excel, use the Export Data Only option.
Generate a Report
- Go to Reports > Report Center to run an Accolent report.
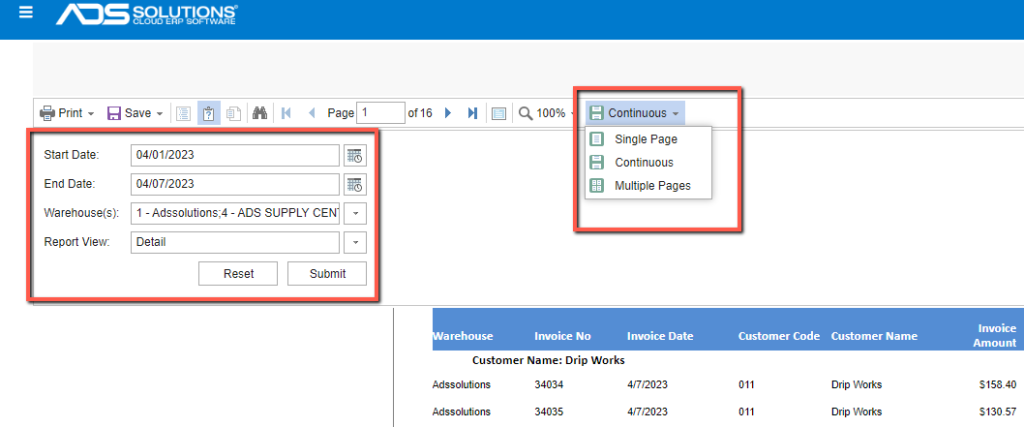
- Select the report parameters and View Report Detail or Summary.
- The Summary view presents only the sub-totals.
- Set the report to show one page at a time or to scroll continuously.
Printed Reports
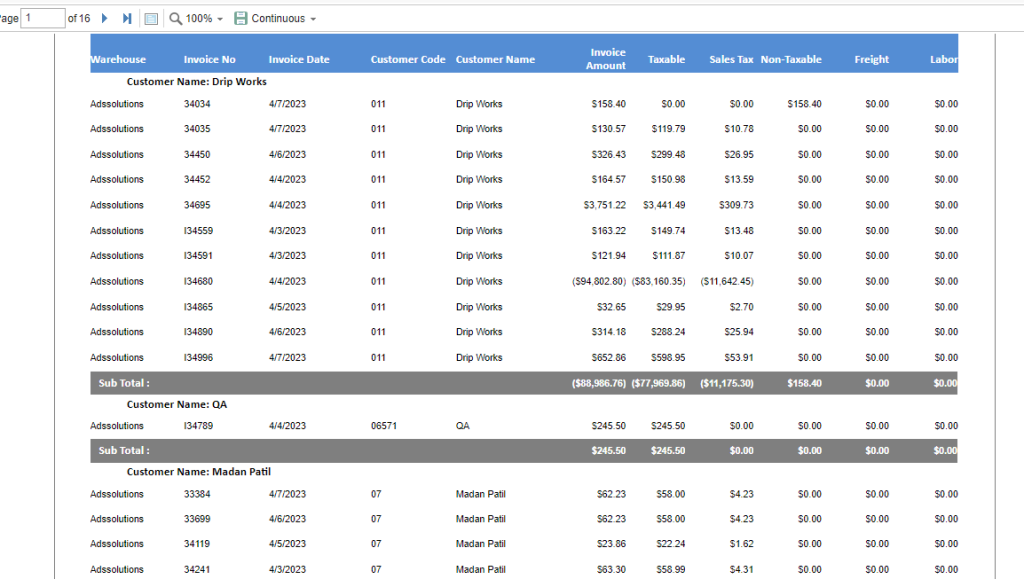
- By default, all reports will appear as formatted printable reports, designed to print on standard 8.5” x 11” paper.
Download Reports
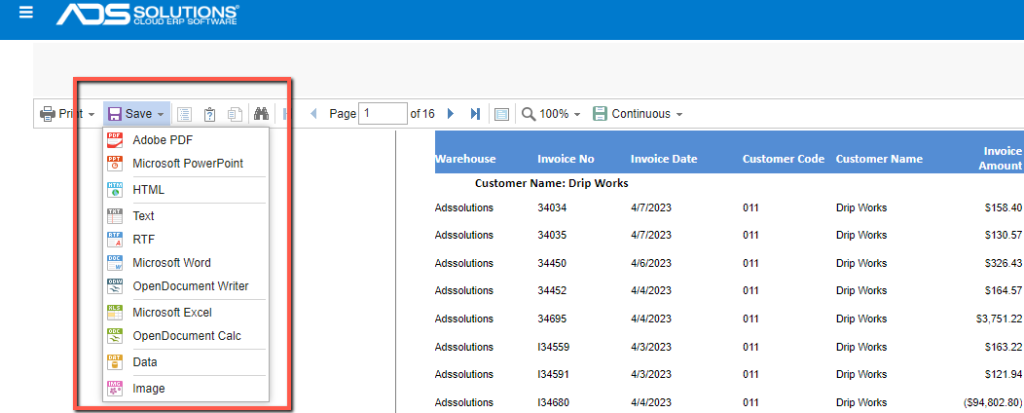
- To change the report format, use the dropdown under the Save button.
- Select from a variety of downloadable export formats.
Exporting to Excel
- If exporting to Excel, use the Settings options to export the file as a formatted or unformatted spreadsheet.
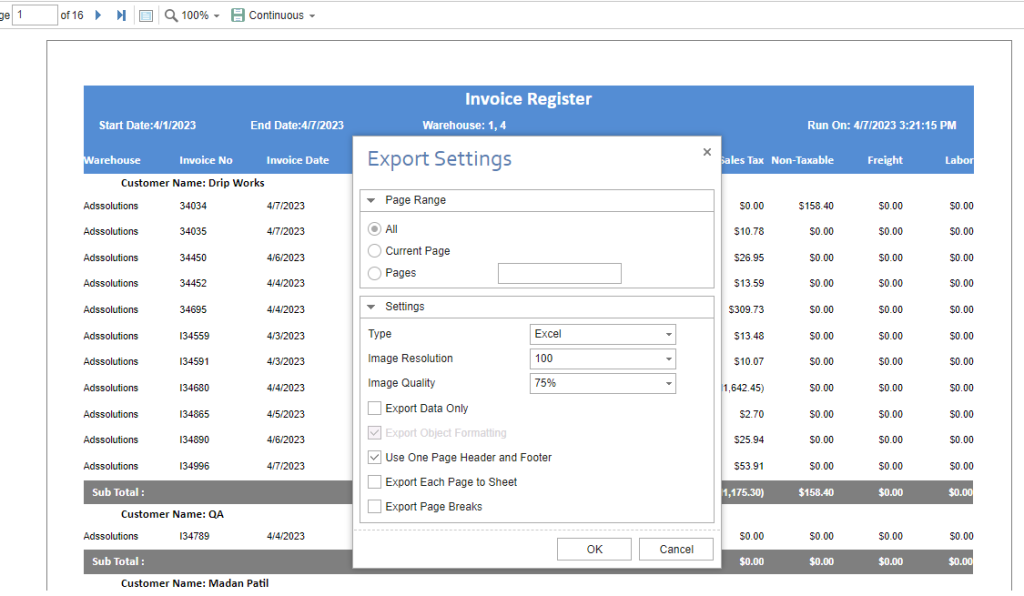
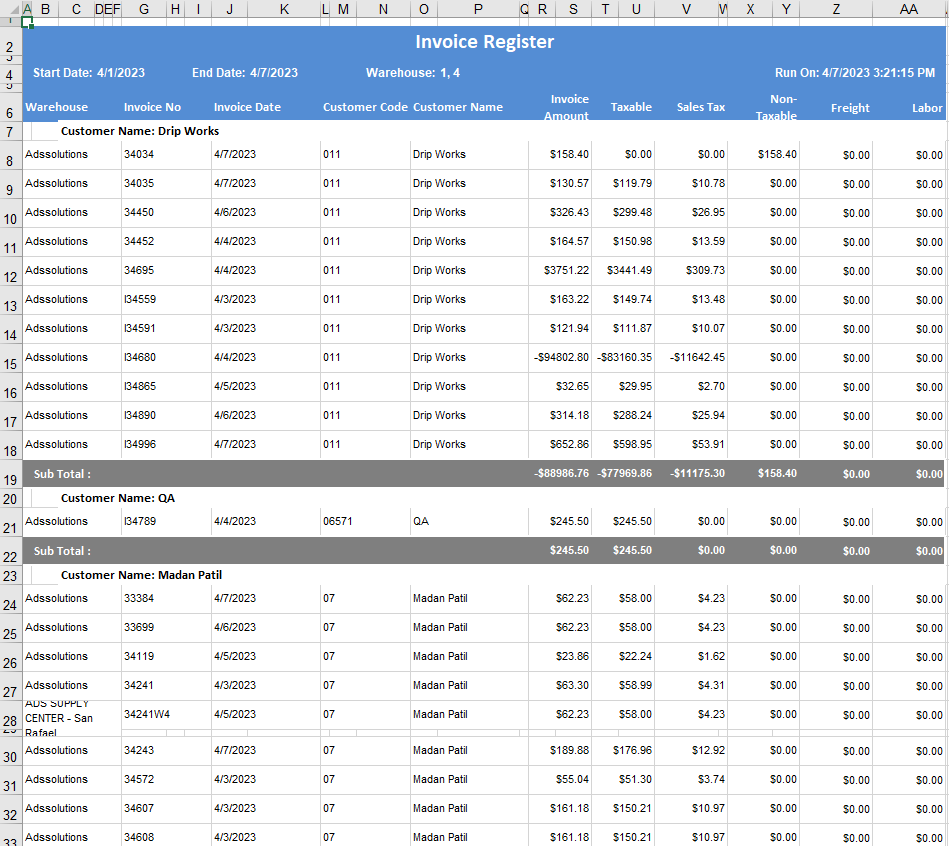
- The formatted Excel download is used mainly to print the report from Excel.
- Use the Export Object Formatting selected and Use One Page Header and Footer.
- This is the Excel export preserving all the formatting with a single header and footer.
Exporting to Excel for Analysis
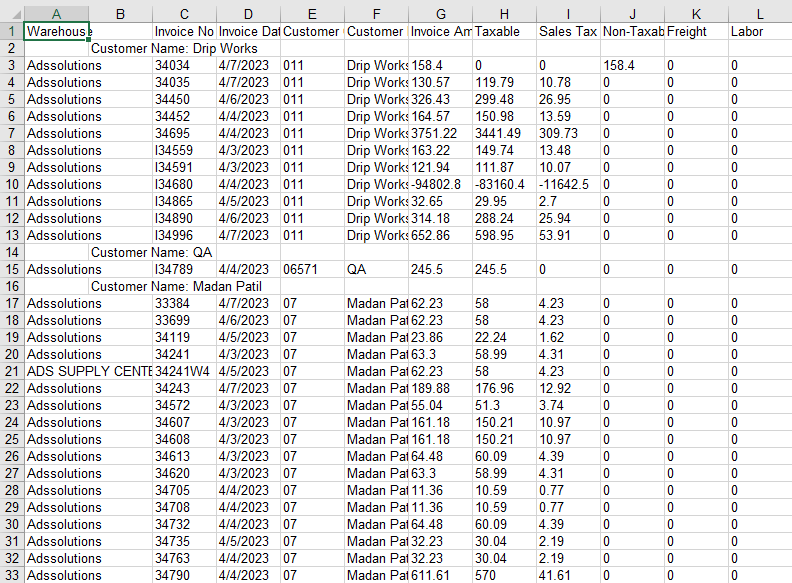
- To analyze the data in Excel, use the Export Data Only setting.
- Use the Excel filters and sort options to view the data in multiple ways.
- The sub-totals use a separate column, in this case Column B.
- This is the unformatted Excel download with the Export Data Only setting.
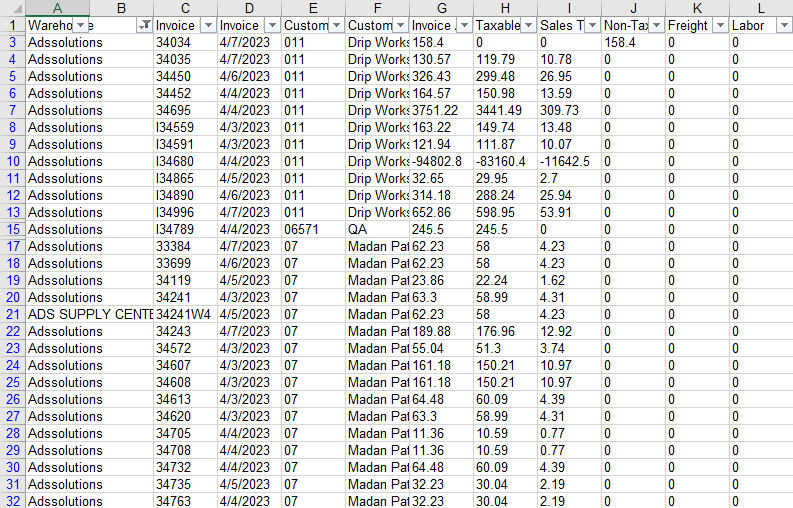
- By filtering the columns and selecting on Column B the data can be viewed by Customer.
- To view the data for all Customers, select Column B and filter on blanks.
- To view the data by Warehouse, sort on Column A.
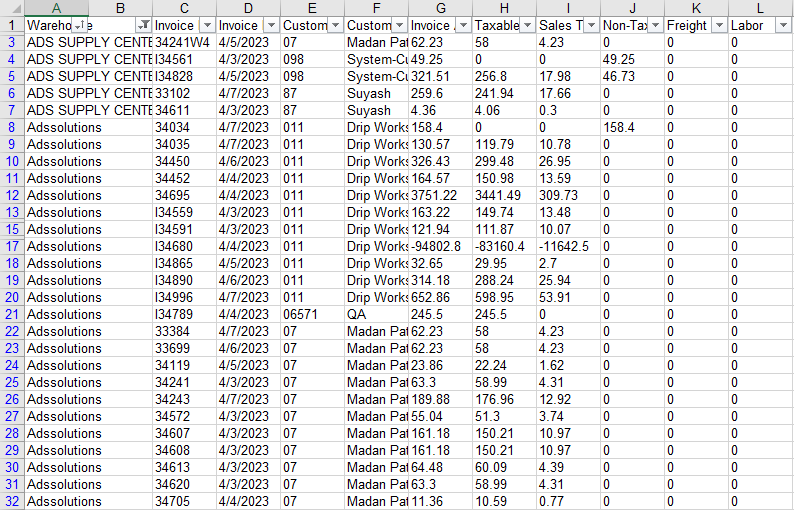
- No formatting at all of the Excel spreadsheet is needed to get any total for either the whole population or any subset of the population.
- Use the filters to select the desired population.
- Then to create a total for the filtered list use the Excel function “subtotal(109, …….)” across the whole range of the data.
- The total for Warehouse ADS SUPPLY CENTER is $696.95.

- Similarly, by filtering again, the total for Customer 098 for Warehouse ADS SUPPLY CENTER is $370.75.
